Data Led Growth project | Honeywell Technology Solutions
Decrease the number of tickets created on the Aero
🙇♀️ Problem Statement
Increase the efficiency of tracking technical cases created on the Honeywell Aerospace Portal by streamlining processes and reducing manual efforts by at least 30%.
Link to revamped portal .
🌟 Overview
Honeywell Tech Support Portal is designed to help our customers to search for solutions to problems they are facing with maintenance or installation of any part of their aircraft which is manufactured by Honeywell.
It became very essential during COVID that the users are able to use the portal efficiently due to limited in person support from Field Engineers .
A Few changes were done to the portal in Sep 2020 :
a. Browse By - Users will be able to browse Technical Solutions by the following:
- Aircraft
- Product
- ATA Chapter

b. Popular Technical Solutions - Users will be able to see a highlight of the top 8 most popular technical solutions
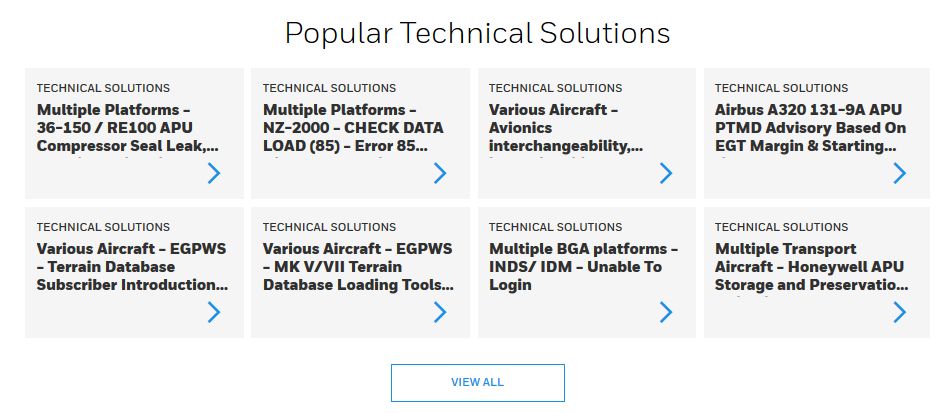
c. Technical Solutions Search Results
Robust, dynamic filtering capability for easier and exact search. Detailed information on each result card, so users do not need to click through an article to see high-level detail.
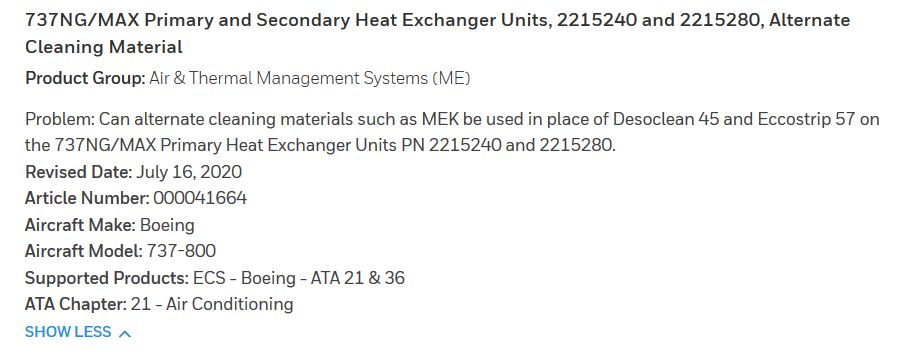

d. Download as PDF
There is an option to download a technical solution article as a PDF

Core Problem
- Increase in the time spent in resolving technical cases from Q4 2020-Q2 2021
- No streamlined method to calculate how many users are able to "self serve " themselves and how many still find it difficult to navigate after the above changes were made .( change in the definition of "activated users ")
- Discrepancy in the "self serve " percentage across verticals
Solution
Develop a Tableau Dashboard which fetches the case creation data from multiple Databases and analyse trends to make the portal more efficient for the customers.
This Dashboard will show the number of cases created each month , time they spend browsing the portal , number of sessions / per user , time after which they created a ticket , date of ticket created , self serve ( activated users ) and self serve percentage .
🤔 Hypothesis
If we accurately calculate self serve % on our Tableu Dashboard , then our portal activation rate will increase upto 54% due to clear understanding of what information to focus on .
🎯 Goal
Increasing the active engagement on the portal will help the team to organise the portal in a way which increases the usability of the portal . It will in-turn help reduce manual labour and directly impact the revenue generated ( 1.5M dollars in 14 months projected due to reduction in manual effort)
✅ Success metric
a. Accuracy of case tracking
b. Adoption of Dashboard across customer and support team.
Worst Case : New calculations doesn't improve the activated user rate on the portal and increased manual efforts
Best Case : Reduction in manual efforts by atleast 30%
🧪 Experimental Design
TLDR : Effectively calculating the self serve % in a month and how the users are using the portal to streamline the portal
Scenarios :
- User logins in with the email id , searches the portal , finds a solution to their problem, doesn't create a case
- User logins in with the email id , doesn't search the portal , directly creates a case using webform or SFDC.
- User logins in with the email id , searches the portal , views the videos or technical publications , or articles ,doesn't find a solution , creates a case using webform or SFDC
In the above listed scenarios, only scenarios 2& 3 are considered for the calculation of total cases created .
Flag No case creation but activity as 0( success ) and case created with activity or no activity as 1
Self Serve % Formula = (Sum of Zeros / Total cases created)*100
Variation Design
New Change :
- User logins in with the email id , searches the portal , finds a solution to their problem, doesn't create a case - no change still stays irrelevant
- User logins in with the email id , doesn't search the portal , directly creates a case using webform or SFDC. - if the case is not created within 48 hrs , this becomes irrelevant
- User logins in with the email id , searches the portal , views the videos for >=2 mins or technical publications for 10mins , or
articles,doesn't find a solution , creates a case using webform or SFDC within 48 hrs - if the video is viewed for less than 2 mins or the publication is viewed for less than 10 mins, it becomes irrelevant. Articles were a small number in 2020 so they were excluded from the calculation - Dashboard shows a line chart of numbers of cases plotted against each month and filters for date , month , year , by internal and external users.
Flag No case creation but activity as 0( success ) and case created with activity or no activity (with new scenario 2 and 3) as 1
Self Serve % Formula = (Sum of Zeros / Total cases created)*100
Cohorts
Test Group 1 : 100 people
Release Dashboard to technical experts handling the cases on Airbus and Boeing only
Control Group : 3000 people
The rest of the experts were using manual methods to calculate the self serve % and total cases created for other products
💻 Implementation of A/A test
The results on the Tableau Dashboard after modified automated calculation vs manual calculation were the same in the test group .
💡 Post Experiment
Experiment Results
After using the numbers shown on the Dashboard continuously for 3 months , the technical experts were able to :
- Measured the accuracy of case tracking by comparing the discrepancies in case records before and after the implementation.
- Decreased in number of duplicate tickets for Airbus and Boeing by 10%
- Understood the user behaviour on the portal and organise the information on the portal according ( increase the count of videos since they were the most viewed out of all the solutions offered)
- Reduction in man- hours ( 30% seen after 14 months of successfully using the Dashboard )
- Introduced another tab ( after 3 months ) which gave a detailed view of the cases created by user . This helped the Technical engineers to dive deeper into the products which faced the problem often .
Release Decision
Scale the experiment to remaining aircrafts types.
Learnings
- The definition of activated user is important to measure the engagement on the portal .
- Understand the user behaviour to design the use cases and edge cases efficiently.
- Keep stakeholder in loop for any changes and train them to use the Dashboard efficiently.
- Focus on A/A testing while scaling it for different businesses.
Next steps
Understand how to scale for Safety Productivity Solutions
Timeline and milestones not defined yet .
Brand focused courses
Great brands aren't built on clicks. They're built on trust. Craft narratives that resonate, campaigns that stand out, and brands that last.


All courses
Master every lever of growth — from acquisition to retention, data to events. Pick a course, go deep, and apply it to your business right away.


Explore courses by GrowthX
Built by Leaders From Amazon, CRED, Zepto, Hindustan Unilever, Flipkart, paytm & more
Course
Advanced Growth Strategy
Core principles to distribution, user onboarding, retention & monetisation.
58 modules
21 hours
Course
Go to Market
Learn to implement lean, balanced & all out GTM strategies while getting stakeholder buy-in.
17 modules
1 hour
Course
Brand Led Growth
Design your brand wedge & implement it across every customer touchpoint.
15 modules
2 hours
Course
Event Led Growth
Design an end to end strategy to create events that drive revenue growth.
48 modules
1 hour
Course
Growth Model Design
Learn how to break down your North Star metric into actionable input levers and prioritise them.
9 modules
1 hour
Course
Building Growth Teams
Learn how to design your team blueprint, attract, hire & retain great talent
24 modules
1 hour
Course
Data Led Growth
Learn the science of RCA & experimentation design to drive real revenue impact.
12 modules
2 hours
Course
Email marketing
Learn how to set up email as a channel and build the 0 → 1 strategy for email marketing
12 modules
1 hour
Course
Partnership Led Growth
Design product integrations & channel partnerships to drive revenue impact.
27 modules
1 hour
Course
Tech for Growth
Learn to ship better products with engineering & take informed trade-offs.
14 modules
2 hours
Crack a new job or a promotion with ELEVATE
Designed for mid-senior & leadership roles across growth, product, marketing, strategy & business


Learning Resources
Browse 500+ case studies, articles & resources the learning resources that you won't find on the internet.

Patience—you’re about to be impressed.